



Most team performance measurement systems fail because they track outcomes after they've already gone wrong. You're looking at project completion rates dropping, customer satisfaction scores tanking, or revenue targets missed—but by then, the damage is done. The real challenge isn't measuring performance; it's building a cascade that gives you enough warning to actually do something about it.
Teams drown in metrics that don't connect. Marketing tracks lead volume, engineering tracks velocity, support tracks ticket resolution—but nobody sees how a slowdown in engineering creates a ripple that hits support tickets three weeks later. The metrics exist in isolation, making it nearly impossible to spot problems until they've already compounded.
You don't need fewer metrics or a fancier dashboard. You need a structured measurement cascade that flows from outcome metrics down to operational indicators, with clear trigger rules that tell you exactly when and how to intervene.
The Three-Layer Measurement Architecture
A functional team performance measurement system runs on three distinct layers, each feeding information upward while triggering actions downward. Think of it like monitoring a manufacturing line—you don't just count finished products; you track machine temperatures, material flow rates, and quality checkpoints throughout the process.
Layer 1: Outcome Metrics These are your ultimate scorecards—revenue per employee, project success rate, customer retention. They tell you if you're winning or losing but arrive too late to change course. Feature adoption rate is a great outcome metric for a software team. Useful for quarterly reviews, mostly useless for daily operations.
Layer 2: Leading Indicators These predict your outcomes before they materialize. If your outcome is on-time project delivery, your leading indicators might include sprint commitment accuracy, blocker resolution time, and scope change frequency. When these start drifting, you've usually got two to four weeks before outcomes follow.
Layer 3: Operational Metrics The daily heartbeat of your team. Task completion rates, meeting attendance, code review turnaround times. These fluctuate constantly but follow recognizable patterns. When the patterns break, your leading indicators are about to shift.
| Metric Layer | Example Metrics | Update Frequency | Action Window |
|---|---|---|---|
| Outcome | Feature adoption rate, Revenue impact | Monthly | Post-mortem only |
| Leading | Sprint velocity trend, Bug escape rate | Weekly | 2-3 weeks to correct |
| Operational | Daily standup blockers, PR merge time | Daily | 1-3 days to correct |
The connection between these layers only works if you have clear escalation triggers. Not every metric deviation matters—but when operational metrics drift for three or four consecutive days, a leading indicator is usually about to break.
Mapping Your Outcome-to-Operation Chain
Building a measurement cascade starts with reverse engineering from your critical outcomes. Pick one outcome that matters. Take "customer implementation time" for a B2B SaaS team—currently sitting somewhere around six weeks, with a target of closer to four.
Eliminate team chaos and missed deadlines.
Temsly helps you assign, track & complete projects efficiently with full visibility.
- Centralized task management
- Real-time team communication
- Resource and deadline tracking
No credit card required
Work backward. What actually has to happen for implementation to complete? Technical setup, data migration, user training, go-live verification. Each stage has dependencies and failure points.
Your leading indicators emerge from those dependencies:
-
Technical setup completion rate by day 10
-
Data validation errors per migration
-
Training session attendance rate
-
Feature configuration accuracy
Then identify the operational metrics driving those indicators:
-
Support engineer availability hours
-
Migration script test coverage
-
Customer response time to scheduling requests
-
Documentation update frequency
Each layer gets more granular and actionable. You can't directly fix "implementation time," but you can absolutely fix "support engineer availability hours."
The measurement chain looks something like this:
-
Outcome
Average implementation time running long
-
Leading indicator
Technical setup incomplete by day 10 on roughly a third of accounts
-
Operational metric
Support engineer availability below target hours per account per day
When you see engineer availability drop for two consecutive days, you know that account's implementation is at risk. That's actionable intelligence, not historical reporting.
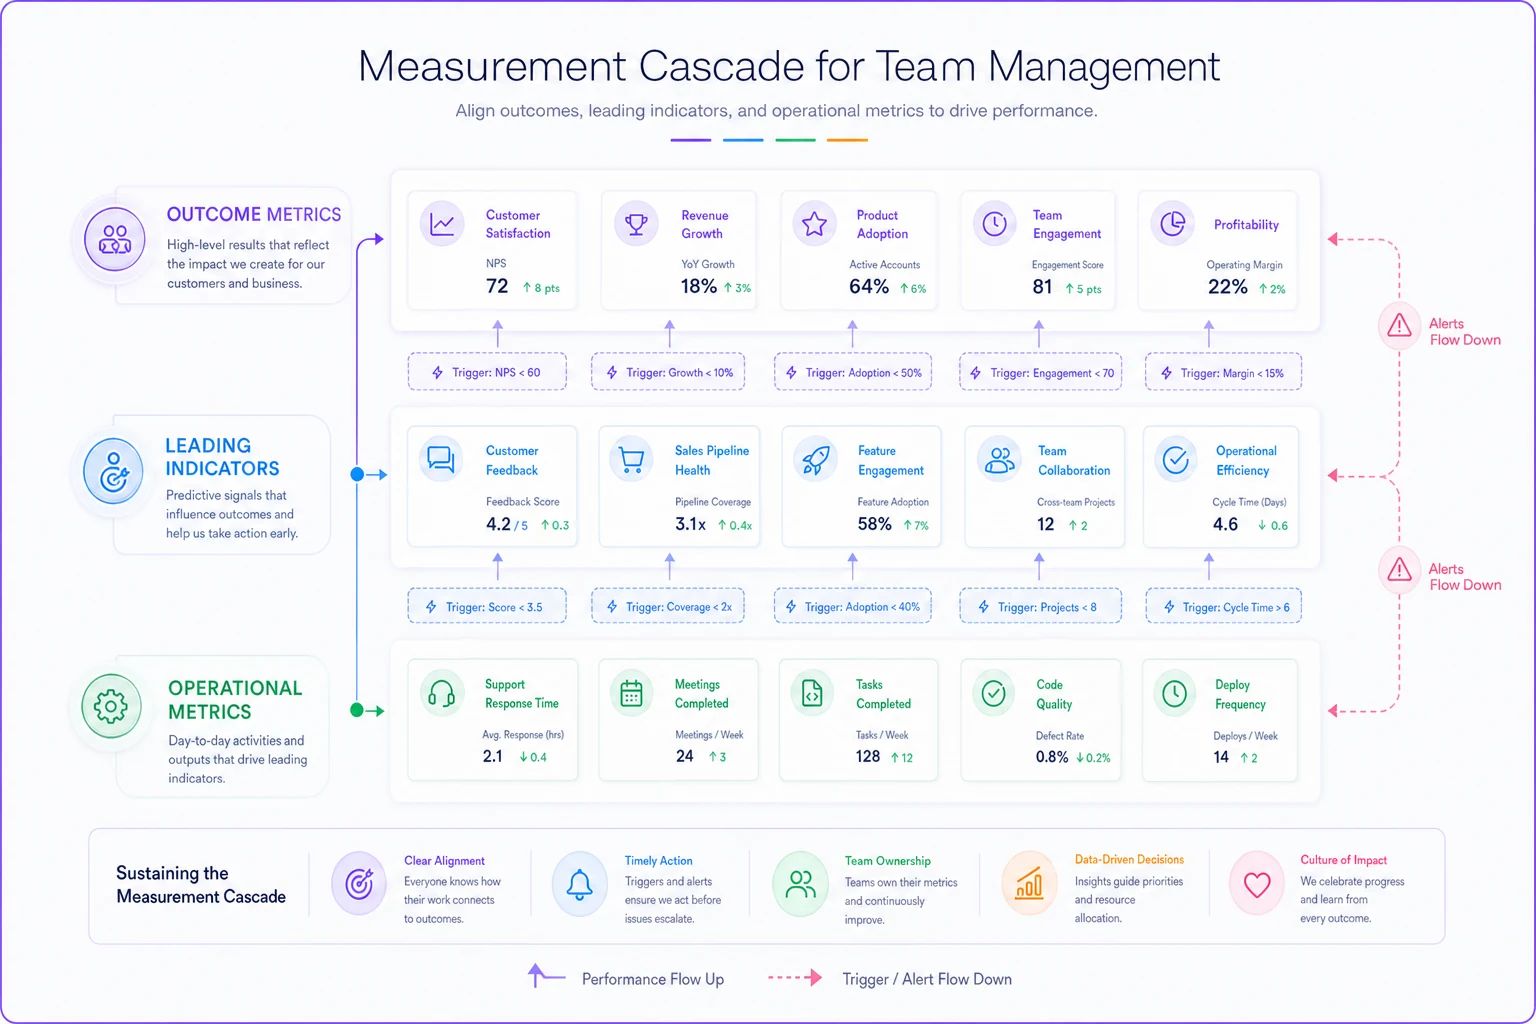
This visual maps the flow from operations to outcomes.
Building Trigger Rules That Actually Work
Dashboard triggers fail when they cry wolf constantly or stay silent during real problems. The key is understanding variance patterns in your specific operation. A 10% dip in daily task completion might be noise for a creative team but a genuine problem for a support desk.
Start by establishing baseline variance for each metric. Track your operational metrics for about a month without intervention. Calculate the standard deviation. Set warnings at roughly 2x standard deviation, escalations at 3x.
Here's a rough example of what that looks like in practice for a customer success team:
-
Average daily customer contacts
somewhere in the mid-40s
-
Standard deviation
around 8
-
Warning trigger
anything more than two standard deviations outside normal
-
Escalation trigger
three standard deviations outside normal
Raw thresholds aren't enough though. You need compound triggers that account for duration and correlation.
Simple Trigger (usually wrong):
-
Alert when response time exceeds 4 hours
Compound Trigger (actually useful):
-
Alert when response time exceeds 4 hours for 3 consecutive measurements AND queue depth is increasing
A trigger rule template you can adapt:
TRIGGER: [Metric Name] Performance Warning
CONDITION:
-
Primary
[Metric] outside [threshold] for [duration]
-
Secondary
[Related metric] showing [trend]
-
Context
Occurs during [time period/condition]
ACTION:
-
Immediate
[First responder] reviews [specific data]
-
If confirmed
[Escalation path] initiated
-
Resolution
[Specific steps to restore performance]
-
Follow-up
[Review process] within [timeframe]
Tune compound triggers to include both duration and a correlated metric to reduce false positives.
Keep the templates simple and test them in alert-only mode before automating escalations.
The Escalation Script Framework
When triggers fire, most teams waste critical time figuring out who should do what. Pre-written escalation scripts remove that decision fatigue during the moments it matter most.
Each trigger needs three escalation levels.
Level 1: Operational Adjustment (Team lead handles)
-
Metric deviation detected
-
Review last 48 hours of activity
-
Check for external factors (holidays, system issues)
-
Implement standard recovery action
-
Document in team chat
Level 2: Resource Reallocation (Manager involved)
-
Level 1 actions insufficient after 24 hours
-
Pull resources from non-critical work
-
Adjust sprint commitments or project timelines
-
Notify affected stakeholders
-
Schedule root cause review
Level 3: Strategic Intervention (Director escalation)
-
Multiple Level 2 escalations within a week
-
Systemic performance degradation
-
Consider structural changes—hiring, tooling, process
-
Formal incident review required
-
Executive notification if warranted
Escalation script template:
ESCALATION LEVEL: [1/2/3]
TRIGGERED BY: [Specific metric condition]
IMMEDIATE ACTIONS (Within 1 hour):
-
[First check]
-
[Data to gather]
-
[People to notify]
DIAGNOSIS STEPS:
-
Check
[System/process component]
-
Verify
[Related metrics]
-
Assess
[Impact scope]
REMEDIATION OPTIONS:
-
Option A
[Quick fix] - if [condition]
-
Option B
[Moderate intervention] - if [condition]
-
Option C
[Major change] - if [condition]
DECISION OWNER: [Role]
COMMUNICATION PLAN: [Who, what, when]
SUCCESS CRITERIA: [Metric restoration target]
REVIEW SCHEDULED: [Timeframe]
Practical Dashboard Design for Action
Most dashboards become graveyards of vanity metrics that nobody actually uses for decisions. The fix is building role-specific views that show only what each person can actually influence.
For individual contributors, the dashboard should show their own operational metrics daily, the team's leading indicators as a weekly trend, and one key outcome metric on a monthly basis.
For team leads, you want all operational metrics with variance alerts, leading indicator trends with trigger status, and outcome projections based on where the leading indicators currently sit.
For managers, the focus shifts to a leading indicator dashboard with heat mapping, outcome metrics with attribution back to leading indicators, and escalation history with resolution effectiveness.
A marketing team's dashboard hierarchy might look like this:
Content Writer View:
-
Articles completed this week vs. target
-
Average review cycles (where does it sit relative to goal?)
-
Team's content velocity trend
Content Lead View:
-
Writer productivity heat map—who's consistently behind?
-
Review bottlenecks by reviewer
-
Publishing pipeline health across all stages
-
Velocity trend vs. quality scores
Marketing Manager View:
-
Content velocity vs. lead generation correlation
-
Resource allocation efficiency
-
Active escalation triggers
-
Outcome forecast
probability of hitting quarterly lead target
The crucial element is an action prompt on each dashboard. Don't just show the number—tell them what to do about it:
-
❌ "Review cycles
2.3"
-
✅ "Review cycles
2.3 (above target) → Check with editing team for capacity"
Good dashboards make the next action obvious. That's the whole point.
Implementation Sequence and Change Management
Teams resist measurement changes because they fear being judged by new standards before they understand them. Rolling this out without breaking your existing operation requires a deliberate sequence.
Start with shadow tracking. Run the new measurement cascade parallel to existing metrics for 30 days. Don't make decisions based on the new system yet—just observe and calibrate. This gives you real baseline data and lets the team see patterns without pressure.
Week 1-2: Deploy operational metrics only. Track everything, alert nothing. Identify natural variance ranges and spot measurement gaps.
Week 3-4: Add leading indicators. Connect operational patterns to indicator movements, test your correlation assumptions, and refine indicator definitions.
Week 5-6: Connect to outcomes. Validate that indicator changes actually predict outcome changes, adjust lag times in your model, and set initial trigger thresholds.
Week 7-8: Enable warnings only. Run triggers in alert-only mode, document false positives and missed issues, and refine trigger conditions.
Week 9+: Full implementation. Enable escalation protocols, begin performance discussions using the new framework, and iterate based on real usage.
The shadow period also reveals workflow gaps you wouldn't have caught otherwise. One development team discovered their "bug escape rate" leading indicator was essentially useless because bugs weren't being categorized consistently across teams. They had to fix the categorization process entirely before the measurement system could work. That's the kind of thing you only learn by running things in parallel for a while.
Common Failure Points and Prevention
Even well-designed measurement systems fall apart when they hit operational reality. These are the patterns that kill most implementations.
Gaming the Metrics Teams optimize for what's measured, sometimes at the expense of the actual goal. A support team measured purely on ticket closure rate might rush resolutions, generating more reopened tickets down the line. Prevention: Always measure potentially conflicting metrics together. Ticket closure rate alongside reopening rate. Code velocity alongside bug density. Sales calls made alongside opportunity quality score.
Alert Fatigue Too many triggers firing creates learned helplessness. Teams start ignoring all alerts, including the ones that actually matter. Prevention: Start conservative—3x standard deviation—and tighten gradually as teams build response muscle memory. Track your alert-to-action ratio. If fewer than 30% of alerts drive any real action, your triggers are too sensitive.
Measurement Theater Teams spend more time discussing metrics than improving operations. The weekly review becomes a defensive exercise rather than an improvement session. Prevention: Enforce a "2-slide rule" for performance reviews:
-
What triggers fired and what we did about them
-
What leading indicators are trending wrong and what the plan is
Context Blindness Your measurement system assumes stable conditions, but reality includes holidays, product launches, and market shifts. Black Friday breaks every normal threshold for an e-commerce team. Prevention: Build context flags into the system. When activated, they modify trigger thresholds or disable certain alerts:
-
Major release week
Increase bug report threshold
-
Holiday period
Adjust response time expectations
-
New hire onboarding
Exclude from productivity metrics for the first month
Forgetting context flags is one of the more common reasons teams lose trust in their own measurement systems. It's worth spending time on.
Making It Stick: Governance and Continuous Improvement
A measurement system without governance slowly drifts into irrelevance. Metrics get stale, triggers misfire, and teams develop workarounds that obscure real problems.
Monthly calibration sessions (30 minutes max) should cover the previous month's trigger accuracy, any threshold adjustments worth making, metrics to add or remove based on actual usage, and updates to escalation scripts based on lessons learned.
Quarterly measurement audits go deeper—validating that leading indicators still predict outcomes, checking for better operational metrics, assessing whether outcome metrics still align with business strategy, and cutting anything nobody looked at in 90 days.
| Meta-Metric | What It Tells You |
|---|---|
| Trigger accuracy rate | True problems vs. false alarms |
| Escalation resolution time | How fast teams actually respond |
| Metric usage frequency | Which dashboards get opened |
| Performance improvement correlation | Whether the system is actually helping |
One surprisingly effective practice: rotate measurement system ownership quarterly. Different people spot different improvement opportunities, and it prevents the system from becoming one person's domain that nobody else fully understands or trusts. When ownership sits with one person too long, the system quietly degrades and nobody notices until something breaks badly.
Templates You Can Deploy Tomorrow
A complete starter kit for implementing your team performance measurement system. Adapt these to your context, but keep the structure intact.
Measurement Cascade Mapping Template:
OUTCOME METRIC: [What you ultimately care about] Current Performance: [Baseline] Target: [Goal] Measurement Frequency: [How often checked]
LEADING INDICATORS (predict outcome 2-4 weeks ahead):
-
[Indicator 1]
Currently [X], indicates problems when [condition]
-
[Indicator 2]
Currently [Y], indicates problems when [condition]
-
[Indicator 3]
Currently [Z], indicates problems when [condition]
OPERATIONAL METRICS (daily/hourly signals): For [Indicator 1]:
-
[Operational metric A]
Measured [how], threshold [value]
-
[Operational metric B]
Measured [how], threshold [value]
For [Indicator 2]:
-
[Operational metric C]
Measured [how], threshold [value]
-
[Operational metric D]
Measured [how], threshold [value]
TRIGGER RULES: Warning Level:
-
[Operational metric] outside [range] for [duration]
-
Action
[Who does what]
Escalation Level:
-
[Multiple conditions]
-
Action
[Escalation path]
Weekly Performance Review Template:
WEEK OF: [Date]
TRIGGERS FIRED:
-
[Date/Time]
[Trigger name] → [Action taken] → [Result]
-
[Date/Time]
[Trigger name] → [Action taken] → [Result]
LEADING INDICATOR TRENDS:
-
[Indicator 1]
[Direction] because [operational driver]
-
[Indicator 2]
[Direction] because [operational driver]
OUTCOME FORECAST: Based on current leading indicators:
-
[Outcome 1]
[X]% likely to hit target
-
[Outcome 2]
[Y]% likely to hit target
SYSTEM IMPROVEMENTS:
-
Trigger adjustment
[What and why]
-
New metric added
[What and why]
-
Process change
[What and why]
Use these templates as starting points and refine them based on real usage and feedback.
Building a team performance measurement system isn't about perfect metrics or beautiful dashboards. It's about creating systematic awareness of how your operation flows from daily activities to business outcomes. Most teams operate blind until something breaks badly enough that everyone notices.
Start small. Pick one critical outcome, map its measurement cascade, and run it in shadow mode for a month. You'll start seeing patterns that were invisible before—the Thursday afternoon productivity drop that predicts Friday's shipping delays, or the correlation between code review backlog and next sprint's bug count.
Teams that make this work share a few characteristics. They treat metrics as operational tools, not judgment weapons. They focus on trends over absolute values. They actually use their escalation scripts instead of improvising when something breaks. And they understand that the measurement system itself needs continuous refinement—it's never really done.
Every operational environment is different. A measurement cascade that works well for a support team will probably fall apart for a creative team. What matters is the structure: outcomes flowing to leading indicators flowing to operational metrics, with clear trigger rules and escalation paths at each level.
If you've already built out your team operating system or implemented systematic capacity planning, layering this measurement cascade on top becomes significantly more powerful. You're not just tracking performance—you're creating predictable operations where problems surface before they become crises.
The difference between teams that consistently deliver and teams that constantly firefight usually isn't talent or resources. It's the ability to see problems coming and adjust before impact. Build the measurement system right, and you'll spend a lot less time explaining why things went wrong.
Ready to elevate your team's performance?
Join 2,000+ teams using Temsly to streamline workflows, boost productivity, and deliver projects on time.